en
 de
 jp
 kor
 fra
 spa
 ru
 pt
 it


Copper Density and Copper Metal Injection Molding (2026)
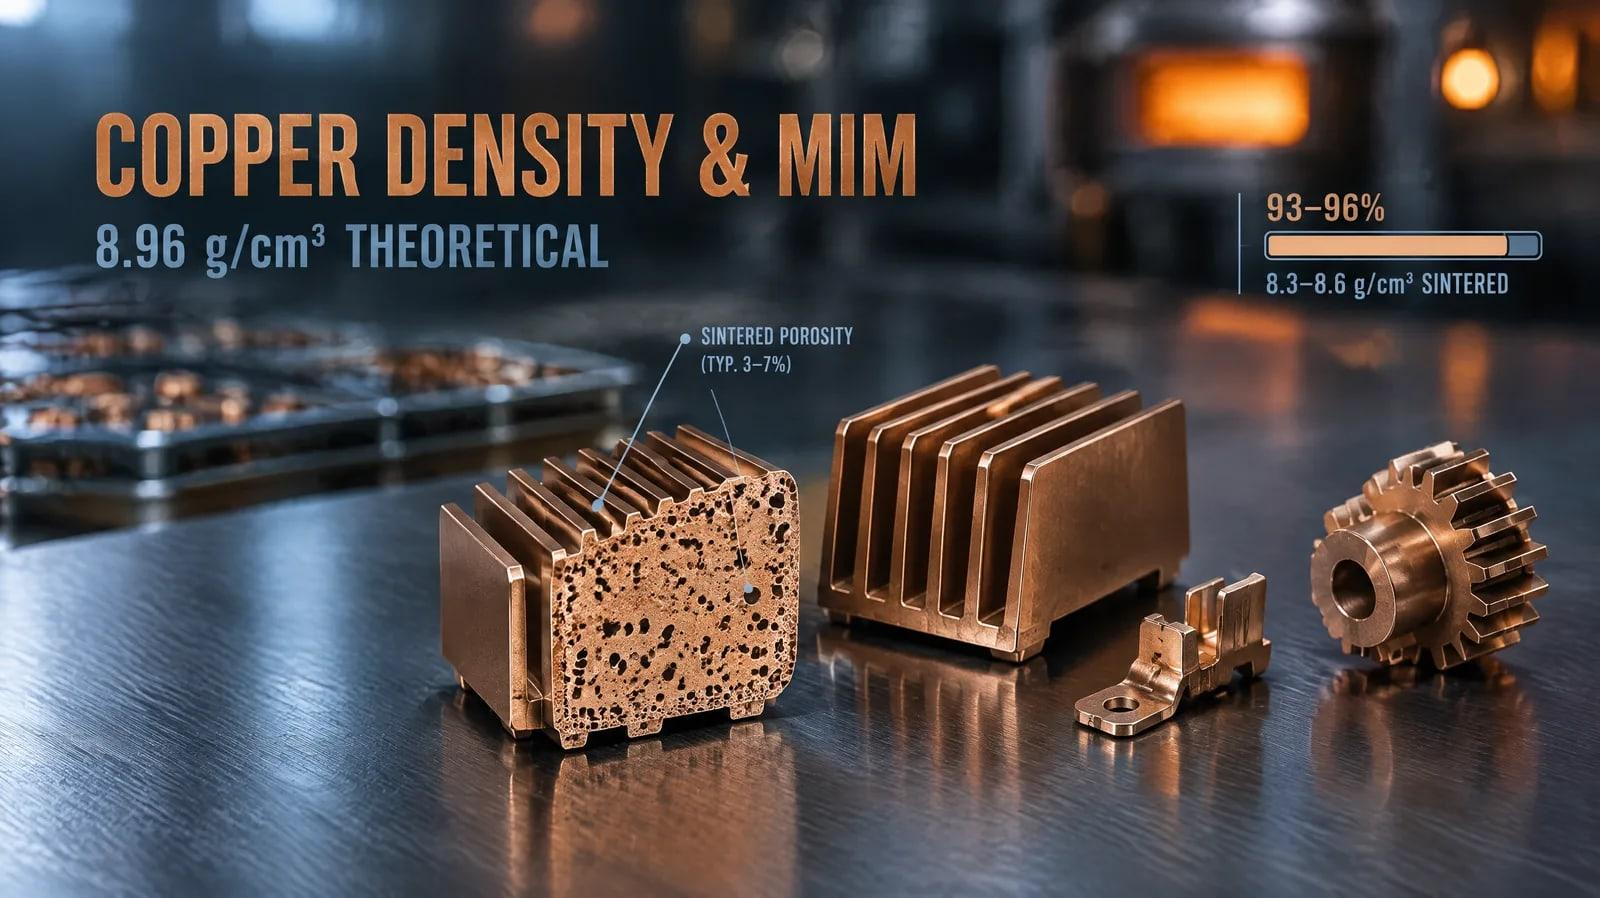
The actual density of pure copper is 8.96 g/cm³. The sintered copper parts produced by metal injection molding (MIM) reach 93–96% of the theoretical density, or 8.3–8.6 g/cm³. Even when the copper is as dense as possible, 4–7% porosity remains in the part. One of the main reasons its thermal and electrical conductivity is slightly below that of wrought copper is the metal injection molding (MIM) process.
The writer discusses the important properties of copper. Copper is dense and an excellent conductor. However, the writer mentions a few specifications that are often overlooked when designing sintered MIM parts. Despite its high density, the writer discusses the metal’s weight in terms of mass. The writer also mentions different brands of copper MIM and their performance in 2026.
Key Takeaways
● Engineers take pure copper as having a relative density of 100%, and its density is approximately 8.96 g/cm³. (AmesWeb, n.d.)
● The base metal used is copper. Metal injection molding molds the powder form of copper and binder. It then removes the binder, and the part is sintered.
● Sintered copper MIM/AM parts usually reach about 8.3 to 8.6 g/cm³, which is about 93% to 96% of theoretical density [Electronics Cooling, 2004].
● Residual porosity reduces the thermal conductivity of MIM copper. A conductivity of 280–385 W/m·K is measured, compared with 388 W/m·K for pure copper (Electronics Cooling 2004; ScienceDirect 2025).
● According to the ResearchGate abstract, the year of the study is not specified. It states that MIM copper’s density can be increased from 93% to approximately 98% with a small investment in processing.
● Copper MIM has enough flow to suit complex, high-volume parts such as heat sinks, although very high conductivity and thick sections may require different routes.
● The shiny nanoparticles’ physical size was assessed in groups using transmission electron microscopy.
What Is the Density of Copper in g/cm³ and lb/in³?
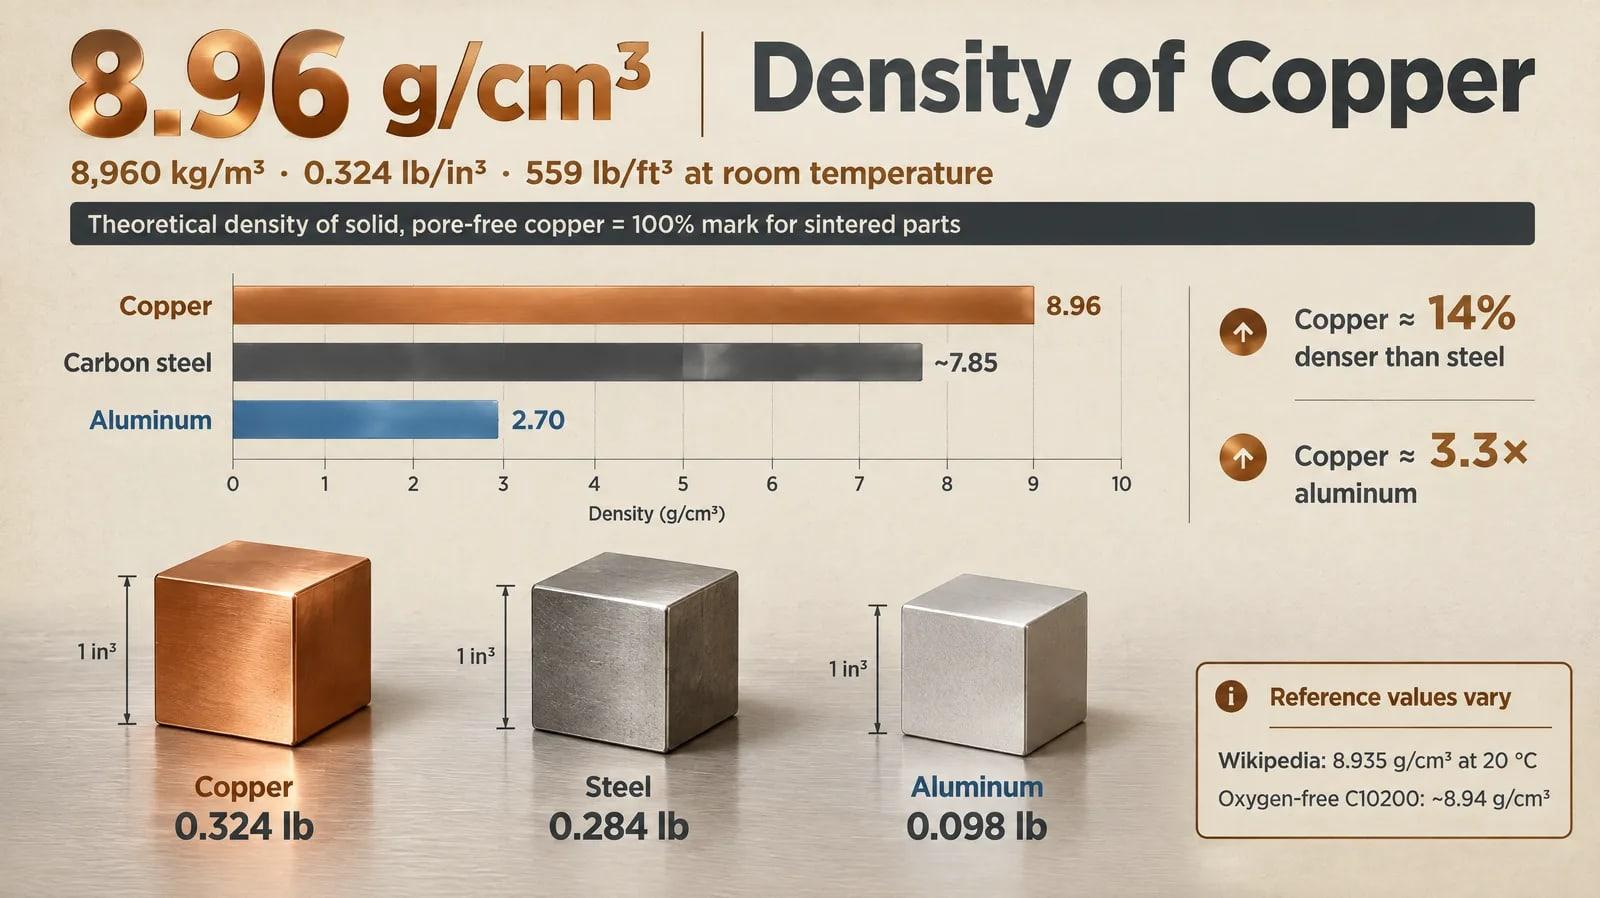
The density of copper is 8.96 g/cm³ at room temperature. In construction-related measurements and records, copper density is referred to in lb/ft³ (AmesWeb, n.d.), which is 559 lb/ft³. According to this source, this is the density of solid, pore-free copper. It represents the 100% mark for the relative density of a sintered part.
According to richconn.com, copper has a considerably high density—almost 14% higher than iron and nearly three times that of aluminium. Copper is denser (8.96 g/cm³ or 0.324 lb/in³) than steel (7.87 g/cm³ or 0.284 lb/in³) and aluminium (2.70 g/cm³ or 0.098 lb/in³), as the figures show.
The reference values differ from the comparison values because a reference value is not expected to equal a comparison value. However, the density of copper is 8.935 g/cm³ at 20 degrees Celsius, while its value in the previous technology is different.
Why does the discrepancy between the two figures matter? Suppose a part has a measured density of 8.512 g/cm³. Compared against a reference density of 8.96, the part is 95.0% dense. Compared against 8.935, the same measured density is 95.3% dense. A 0.3-point gap might seem minor, but it determines whether a part passes a specification. Ask yourself where and by whom the reference density is being quoted whenever you quote a percentage.
What Is Copper Metal Injection Molding (CuMIM)?
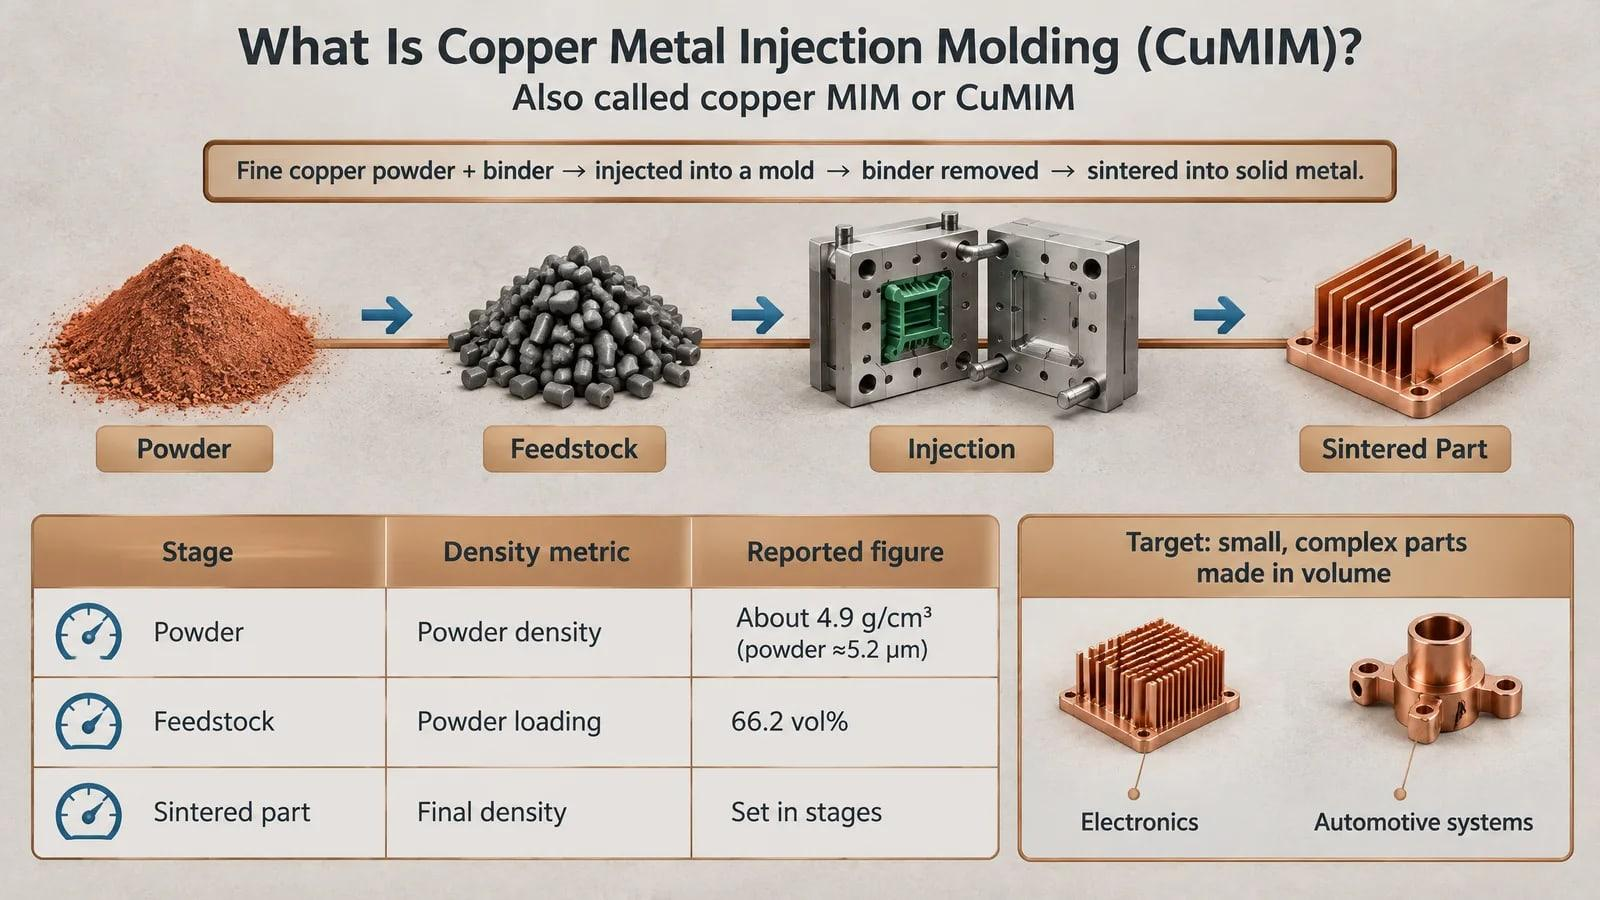
The general process that works by mixing metal powder with a binder and injecting the mixture into a mold, removing the binder and later sintering the part to create a solid metal component is known as metal injection molding, or MIM. Fundamentally, it can be understood as a process in which metal powder particles are held together by a binder. There are a number of suppliers that offer copper sintered parts.
The modulus is represented at various stages, with a specific metric for each phase. The data in the table is extracted from several research papers.
Stage | Density metric | Reported figure |
Powder | Powder density | About 4.9 g/cm³ for powder of about 5.2 µm (PMC/MDPI, 2023) |
Feedstock | Powder loading | 66.2 vol% (ScienceDirect, about 2005) |
Injection | Molding conditions | About 180 °C and about 5 MPa (PMC/MDPI, 2023) |
Brown part (after debinding) | Brown density | No figure in the sources reviewed |
Sintered part | Relative density | 93–96% (Electronics Cooling, 2004) |
How Much Do Copper MIM Parts Shrink During Sintering?
Copper MIM elements shrink by around 10–20% in each direction, depending on the powder filling. As stated in an article on ScienceDirect, nearly equal shrinkage occurs in all three dimensions.
You can figure it out yourself. There should be 66.2 vol% powder, and the volume shrinkage from 0.95 to 0.662 is 0.662/0.95 = 0.697, or about 30%. So, the shrinkage during compaction should be about 30% of its volume. The cube root of 0.697 is about 0.887, so the linear shrinkage should be about 11.3%. If you want a 1.000-in finished part, you need a molded part about 1.13 in long.
What Density Can Copper MIM Parts Achieve After Sintering?
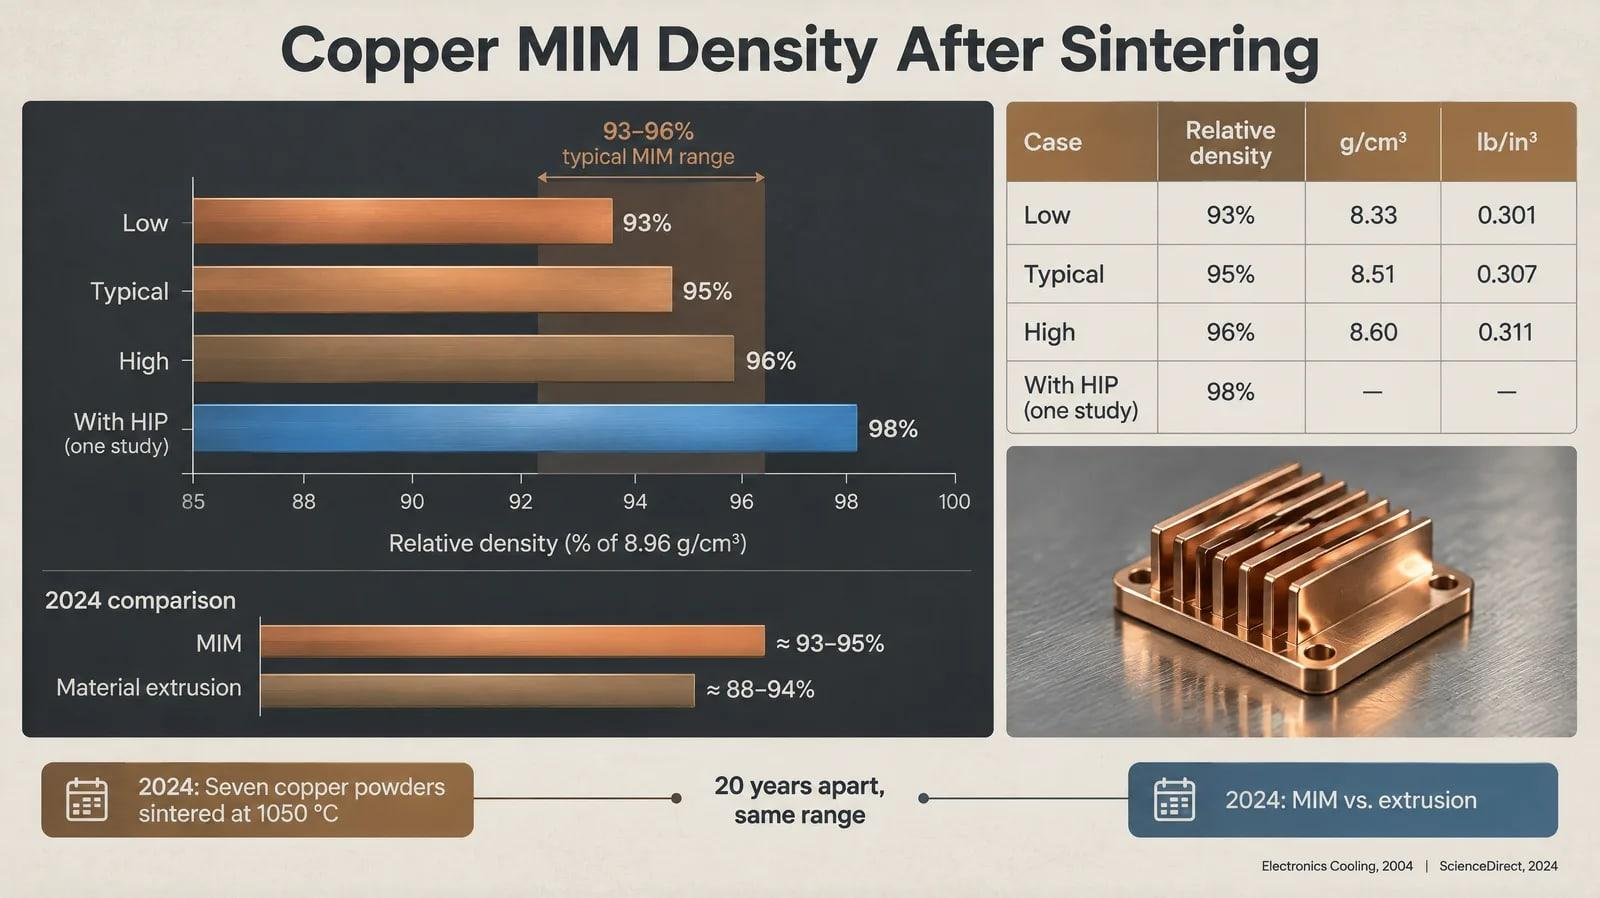
MIM parts made with copper mostly achieve a density of 93% to 96% by sintering the powders. A relative density of 93% to 95% was found in a few MIM specimens, which is better than that of material extrusion and SPS in 2024. The MIM specimens were compared with those made by material extrusion and SPS in 2024. So, we can mostly trust MIM parts made with copper. They must be performing properly, without any hindrance.
The range, however, means the ceiling may not have moved at all. The table converts the range using 8.96 g/cm³. Those two results are 20 years apart and still agree. That makes the range credible.
Case | Relative density | g/cm³ | lb/in³ |
Low | 93% | 8.33 | 0.301 |
Typical | 95% | 8.51 | 0.307 |
High | 96% | 8.60 | 0.311 |
With HIP (one study) | 98% | 8.78 | 0.317 |
According to a study, the density reached 93% after sintering and 98% after Hot Isostatic Pressing (HIP), a process that uses heat and gas pressure to close pores (Source: ResearchGate abstract, undated). However, I could not find the author information or publication date, so this should be treated as indicative only. HIP also increases costs and adds another process step.
A typical example can be calculated using this. A heat sink made of 2 in³ of material weighs approximately 0.647 lb if it is assumed to be solid copper. It weighs 0.602 lb at 93% density and 0.622 lb at 96% density. The difference across this usual range is just ~3% of the mass, so density uncertainty matters more for conductivity than for weight.
Why Is MIM Copper Not 100% Dense, and What Raises It?
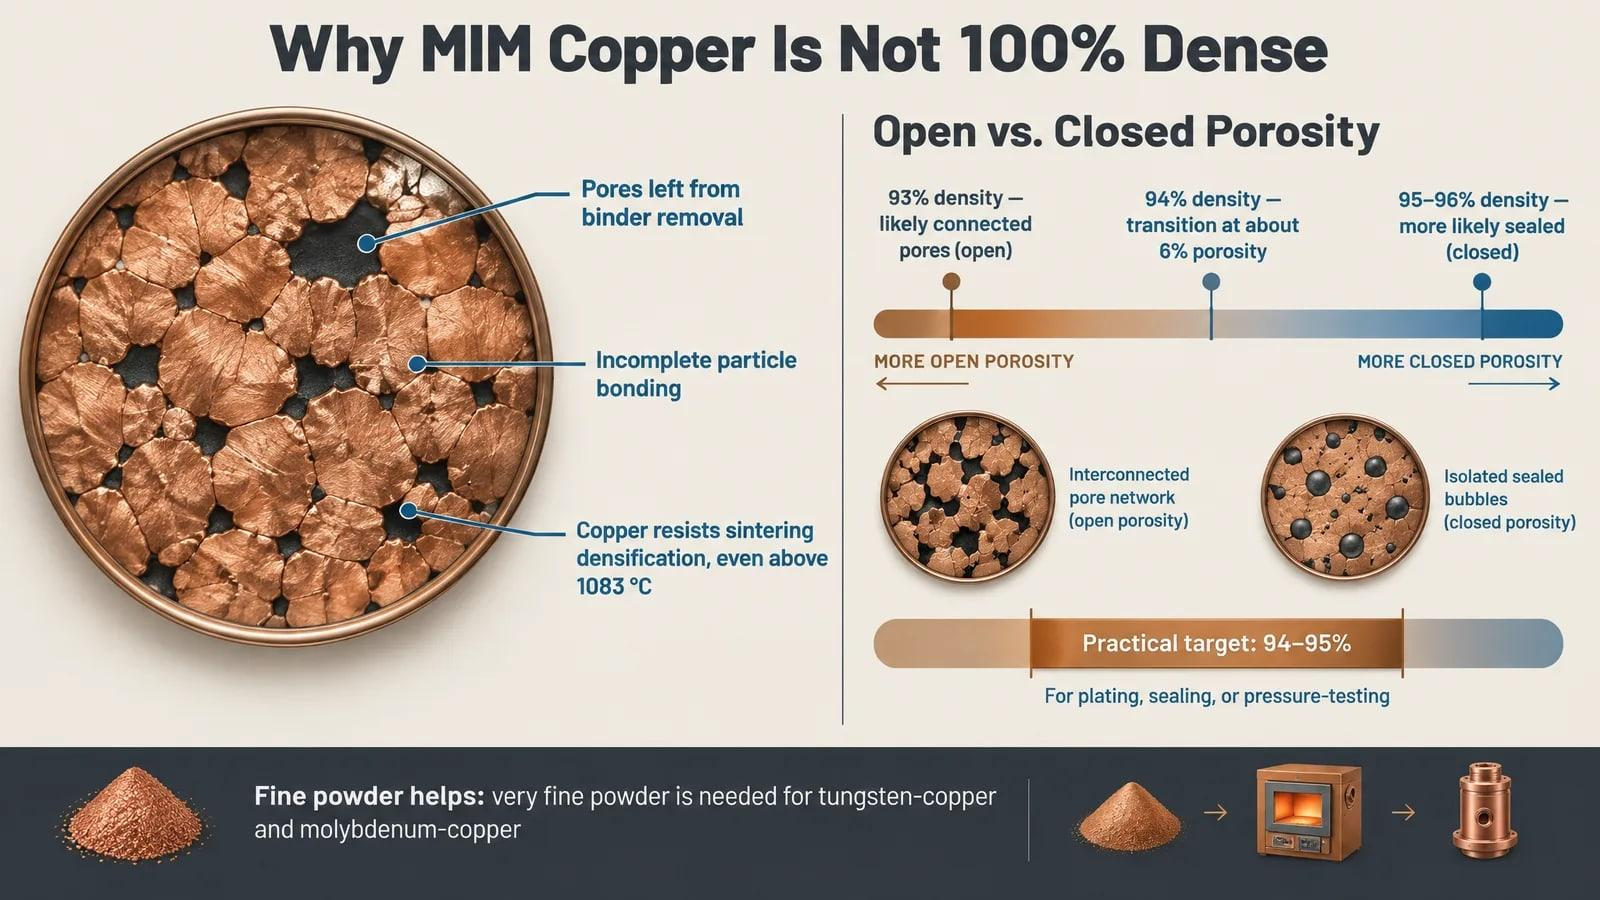
Full density is hard to achieve in copper MIM because, even at high temperatures where copper can sinter, it still resists densification (Electronics Cooling, 2004). Pores caused by binder removal and incomplete particle bonding remain in the part. Tungsten-copper and molybdenum-copper compositions require very fine powder (Electronics Cooling, 2004).
The type of pore matters a lot. When your pores go from open to closed, that happens at around 6% porosity in sintered products, resulting in 94% density. When the part gets to around 93% density, you can bet it still has some connected pores. At around 95–96% density, you would expect the part to be more sealed. And that is why around 94–95% density winds up being a good target when you have to plate, seal, or pressure-test.
The handles being discussed are shown below.
Lever | What it does | Evidence |
Fine powder | Speeds sintering; needed for W-Cu and Mo-Cu | |
Sintering at 1050 °C | Bonds particles below the 1083 °C melting point | Seven powders reached 93–96% at this temperature (same source) |
Reducing atmosphere | Removes oxide films that block bonding | General practice; no figure in the sources |
HIP | Closes remaining pores | About 93% to 98% in one study (ResearchGate abstract, year not shown) |
One crucial pattern emerged. Powders made using different methods had densities of 93–96%. However, their thermal conductivities varied from 280 to 385 W m⁻¹ K⁻¹. These data showed that the choice of powder affected conductivity more than density.
How Does Density Affect Thermal and Electrical Conductivity in MIM Copper?
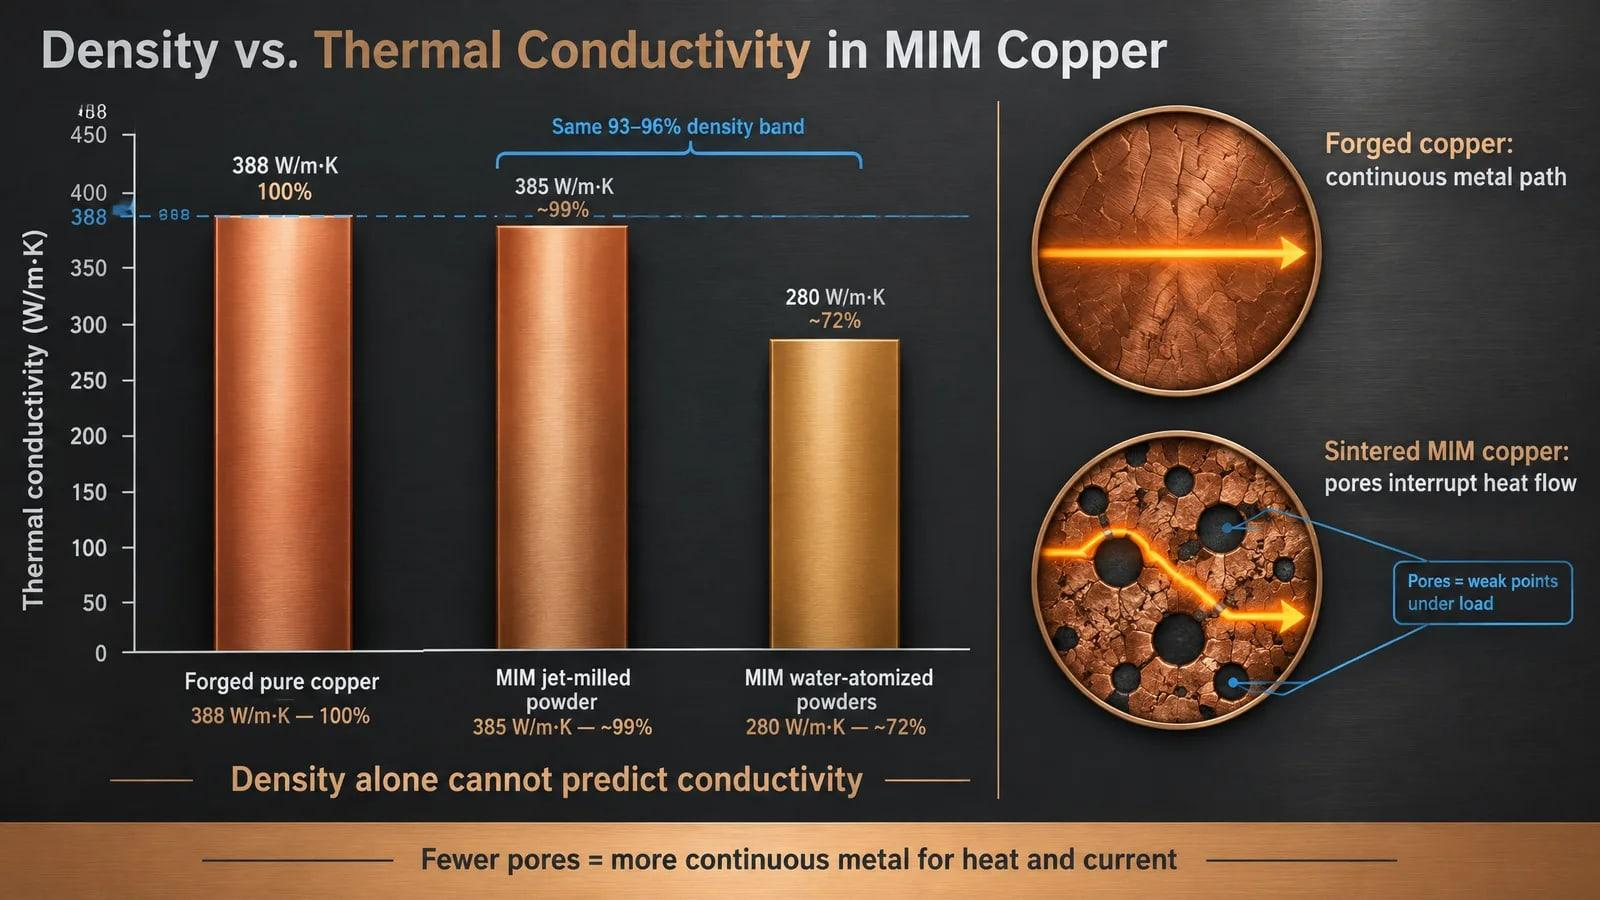
The conductivity depends on the density due to the presence of internal pores that impede the flow of heat through the sintered copper. A higher sintered density results in continuous pathways for heat and electrical current. Pores also act as weak points under load, so higher density is needed. The strength increases with density. Spike Choi, 2025
Two water-atomized powders and a jet-milled powder were used to measure the thermal conductivity of MIM copper samples. According to the website Electronics Cooling, the values ranged from 280 W/m·K to 385 W/m·K in 2004. For forged copper, the conductivity was 388 W/m·K. Therefore, forged copper’s conductivity is 1%–39% higher than that of MIM copper. However, the parts made from low-density (93%–96%) copper showed both the highest and lowest conductivity.
This gap can be easily explained by impurities. One statistical abstract suggested an average impurity level of about 0.15 wt% in powders, which closely matches 280–320 W/m·K (Source: ResearchGate abstract, no publication date shown). Iron is responsible for a decrease in thermal conductivity, and deoxidizers are to blame for the reduced conductivity of cast copper compared with wrought copper (Electronics Cooling, 2004).
You can use density as a floor and impurity level as another check. Differences of 10 W/mK may crop up between two parts at 95%. If your design needs a minimum conductivity, don’t just specify it indirectly as a percentage of IACS or in W/mK; explain it directly as well.
How Does MIM Copper Density Compare With 3D-Printed or Machined Copper?
MIM copper is denser than binder-jetted copper and less dense than laser- or electron-beam-printed copper. The table puts the reported figures side by side, along with the year and process of investigation.
Route | Relative density | Source |
Machined wrought copper | Fully dense stock | Reference case |
MIM | 93–96% | |
MIM (2024 study) | 93–95% | |
Material extrusion (MEX) | 88–94% | |
Extrusion-based AM (other study) | 95.3% | |
Binder jetting | 85.8% | |
SLM | 99.1% | |
EBM | 99.95% |
Springer previously (Springer, 2025) reported relative densities above 99.5% and conductivity above 100% IACS for PBF-EB pure copper. Comparing EBM’s 99.95% with the MIM midpoint of 94.5% gives a gap of 5.45 percentage points, or about 0.49 g/cm³ based on the cited values. That is the density MIM gives up for volume production.
When Should You Not Use Metal Injection Molding for Copper?
You will want to avoid copper metal injection molding (MIM) in applications that focus only on conductivity. The reason is that copper’s thermal conductivity of 280–285 W/m·K won’t match the roughly 388 W/m·K of 100% IACS (International Annealed Copper Standard) forged copper. If cost is not a concern, avoid MIM for very small volumes, as the complex injection tooling requires sufficient volume to pay off. Pure copper also has a higher coefficient of thermal expansion, which can be a headache in systems requiring minimal expansion; tungsten-copper is often a preferable alternative (Source: AMT).
What Should You Ask a Supplier About Copper MIM Density and Conductivity?
You should ask about the method used to measure compactness, the expected compactness, and the conduction requirement, given in some scale. Saying “95% dense” is not meaningful without this information. The questions to ask are presented in this checklist:
1. The method of measurement is density. According to Charles et al. (2025), the density measurement is based on the Archimedes method, in accordance with ISO 2738.
2. In the reference density, either 8.96 g/cm³ or 8.935 g/cm³ can be defined as 100%.
3. What is the minimum relative density for each batch of margarine?
4. Tell me the conductivity of the material (copper) in the data table.
5. What is the cost of the high-pref option, and which density should I choose?
6. Shrinkage: After accounting for about 11–13% shrinkage, what dimensional tolerance can be held?
For example, the first two items belong together for this reason. A part with a density of 8.50 g/cm³ is 94.9% of 8.96 g/cm³, which fails a 95% minimum. That same part at 8.935 g/cm³ is 95.1%, which passes. If a part you haven’t named yet matters now but you’re weighing options, the supplier’s [metal molding services] page can show which processes are available in-house.
Frequently Asked Questions
Is MIM copper as conductive as pure copper?
MIM copper has a thermal conductivity ranging from 280 to 385 W/m·K when tested (Electronics Cooling, 2004), while pure copper has a thermal conductivity of about 388 W/m·K (ScienceDirect, 2025). The best powders come close to that. Typical impurity levels and porosity bring the conductivity of most parts down.
Does hot isostatic pressing improve MIM copper density?
Yes, it was found in one study. A relative density of 93% after sintering and 98% after HIP was reported. This is quite indicative, but the author and year were not visible. Also, since HIP adds a process step and cost, confirm the gains using your supplier’s data.
How do you measure the density of a sintered copper part?
The most common method in studies so far has been Archimedes’ method—measuring weight in air and in a liquid. The 2025 study measured relative density according to the ISO 2738 standard. To calculate it, you can divide the measured density by the density of the solid, 8.96 g/cm³.
Is copper denser than steel or aluminum?
Yes. Copper is 14% denser than carbon steel. It is about 3.3 times as dense as aluminum, so a copper heat sink will weigh more than an aluminum one of the same volume. This can be important for automobiles and portable electronics.
When should you choose tungsten-copper over pure copper MIM?
Use Tungsten-Copper when thermal expansion matters more than conductivity. Pure Copper’s higher expansion is problematic for compact systems, which have to minimize it ({AMT} CuMIM Manufacturing Guide). Very fine powder should also be used in W-Cu compositions (Electronics Cooling, 2004).
Conclusion
The copper density testing method, the reference density behind the percentage, and a conductivity figure in W/m·K or % IACS should be provided in writing before you accept any copper MIM quote. If these criteria aren’t specified, a percentage claim like 93–96% will mean nothing. Even if two parts have similar design densities and meet the same percentage claim, they might conduct electricity differently. If the density and other values meet your design requirements, then copper MIM is a good way to create complex copper parts in volume. If not, consider a different process.